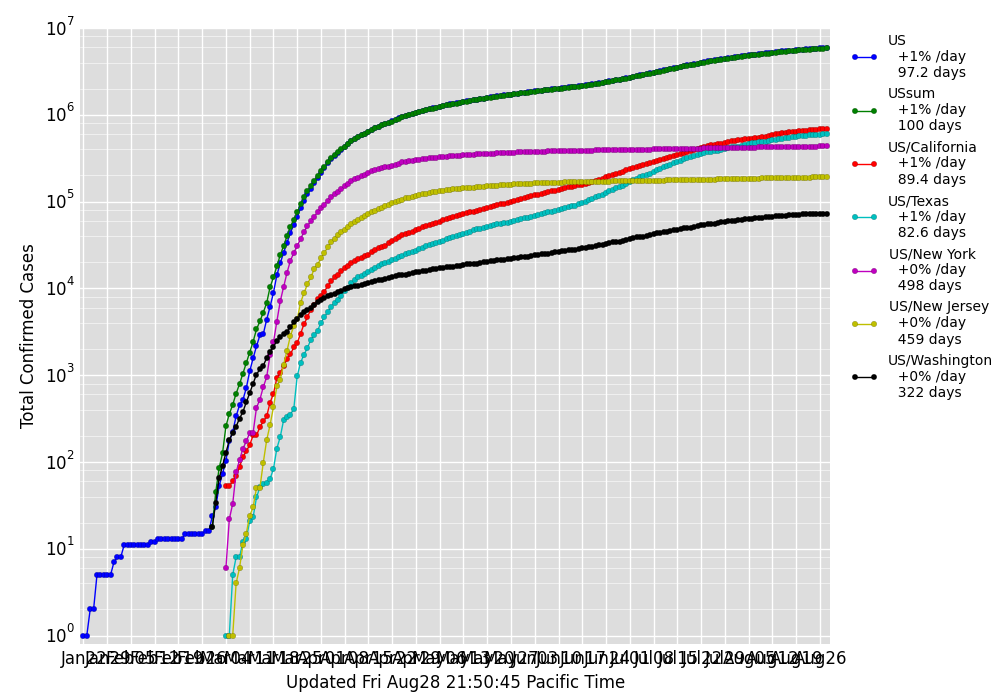
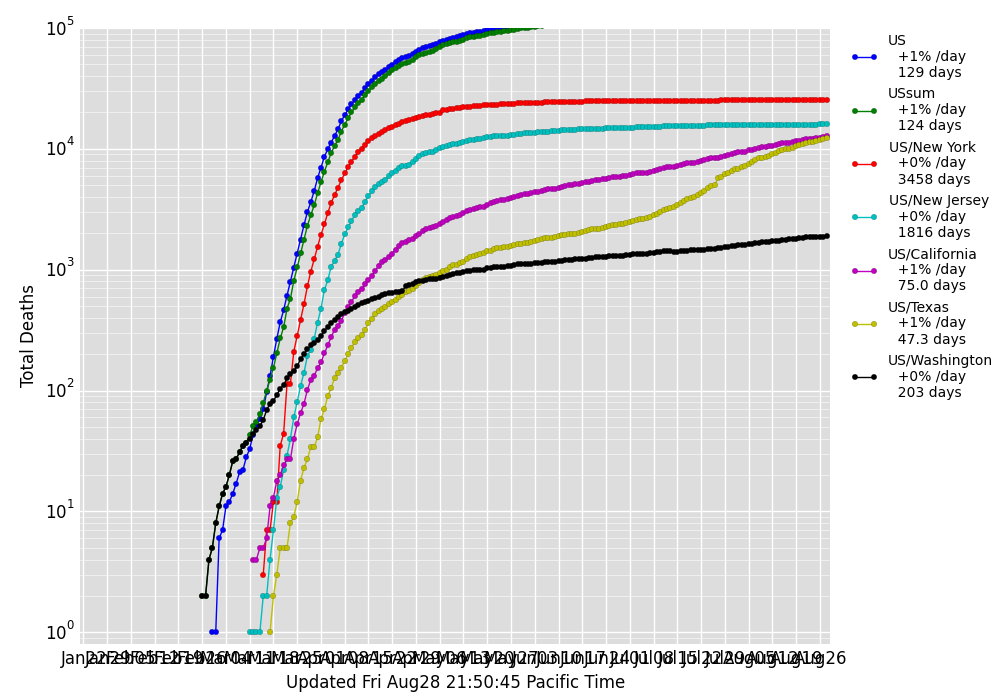
Semi-log plots of the total number of COVID-19 confirmed cases and deaths in selected countries and states, according to the dataset maintained by the Johns Hopkins Center for Systems Science and Engineering (CSSE) (for country-level data) and the COVID Tracking Project (for US state-level data). These plots are auto-updating. Data from this source is typically updated daily, shortly after 5pm Pacific Time.
We also compute an exponential fit from the most recent 7 days of data (shown in grey), and report the result as both the growth rate per day (e.g. +41% /day) and the doubling period (e.g. 2.02 days). For an attempt at plots for instantaneous exponential growth rate, click here.