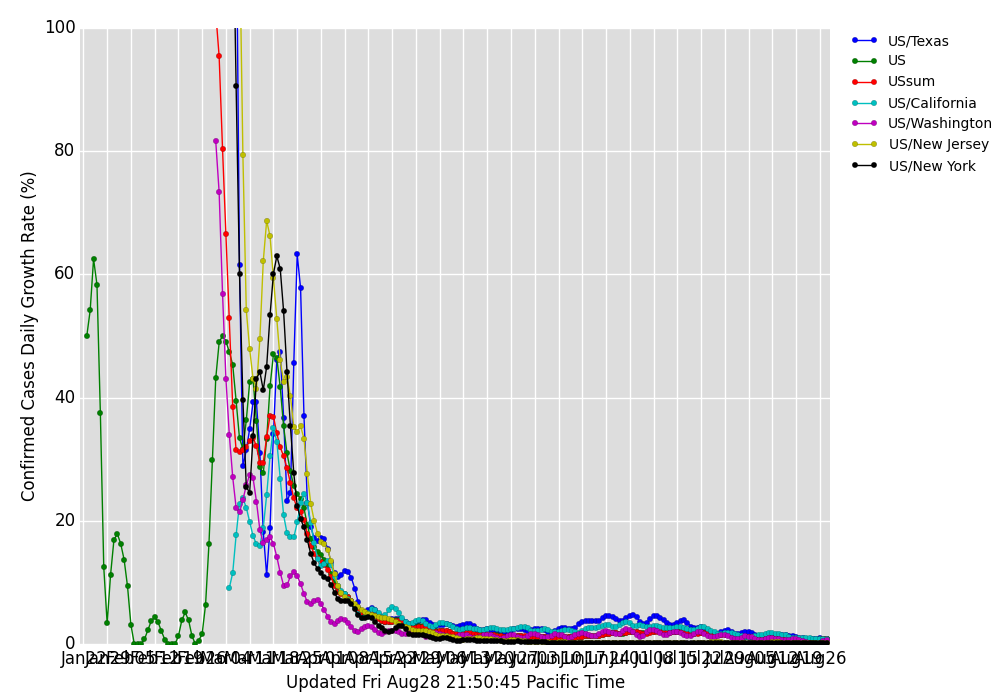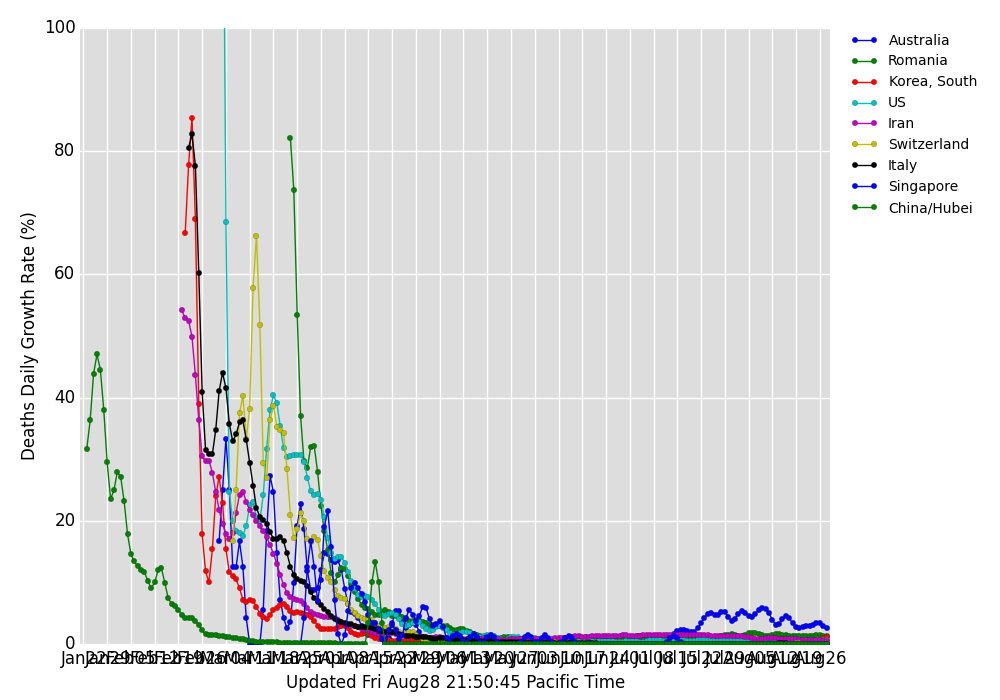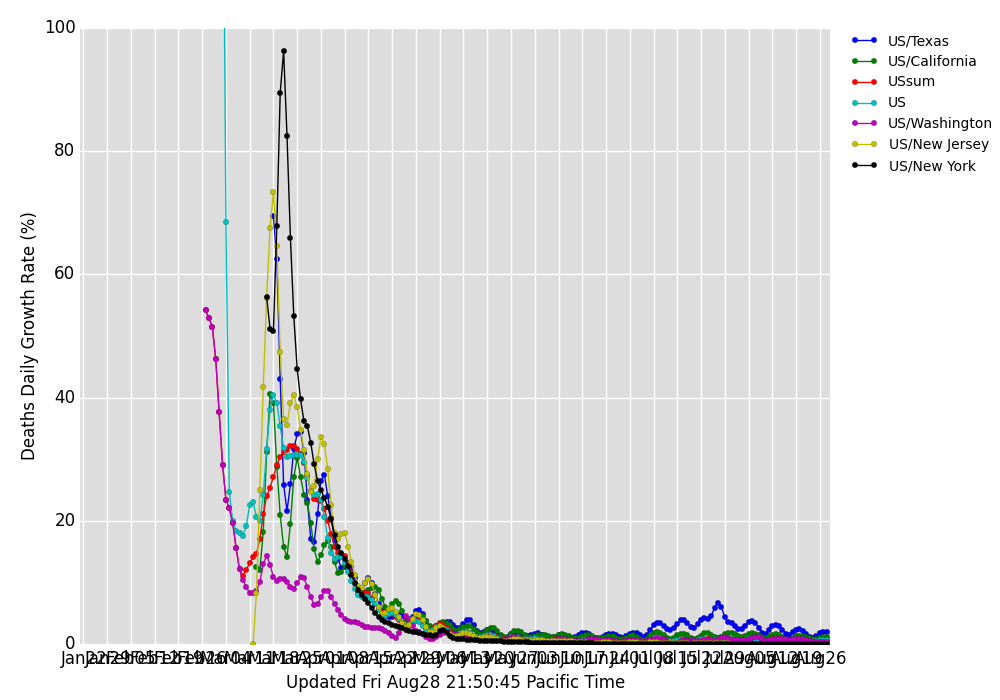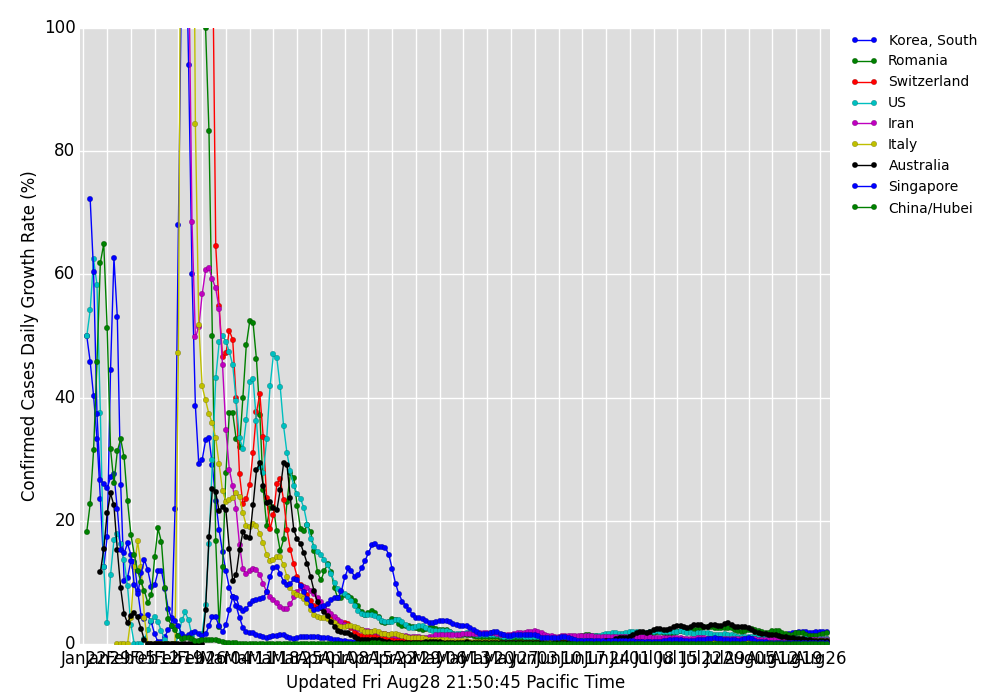
Plots of the groth rates of COVID-19 confirmed cases and deaths in selected countries and states, according to the dataset maintained by the Johns Hopkins Center for Systems Science and Engineering (CSSE). These plots are auto-updating. Data from this source is typically updated daily, shortly after 5pm Pacific Time.
This is an attempt to plot instantaneous exponential growth rate, using a size-7 Hanning window for smoothing. For plots of cumulative cases, click here.